Note: I’ll be giving a talk about this article at the Salem Center at the University of Texas on November 7, the night before the midterm elections. Subscribe to this newsletter to stay up to date on the details. Also, make sure to sign up for the Salem Center/CSPI forecasting tournament if you would like to express a view on this essay or have a chance to win a fellowship at UT. See the rules here, and click here to begin.
Polling is a subject that has always fascinated me. Unlike in most kinds of social science, theories and ideas are consistently tested against reality. Do you think that pollsters and political scientists know what they’re talking about? Well, dozens of organizations and the people who work for them are putting their reputations on the line, and on the night of November 8 we’ll know who was right and who was wrong. This is unlike most areas of expertise, where people make predictions that are often vague or open-ended and accountability is practically impossible.
Of course, one election can’t prove anything. One can assume the polls are biased and just get lucky. But the hope is that by looking at the record of various pollsters over time, we can get an idea both of how good each organization is, and the ability of the polls to forecast election results when taken in the aggregate.
The most ambitious and well-known project to do just this is Nate Silver’s FiveThirtyEight. I’m a fan of Silver, and although this piece is going to provide a critique of some of his ideas, I want to say that I have greatly benefited from his work. I also greatly admire his intellectual honesty. One recent demonstration of this was when, after the 2020 election, he admitted that Trafalgar Group deserved a lot of credit for getting things right despite his previous disagreements with the organization.
In March 2021, Silver published an article called “The Death of Polling Is Greatly Exaggerated.” His argument is that failures in 2016 and 2020 alone don’t discredit polling. Yet a look at the evidence he presents along with some academic research on the subject suggests that there are growing reasons to be skeptical of the entire enterprise.
Are Polls Systematically Biased?
Silver’s main argument in defense of polling rests on the following analogy.
It’s the same incentive that a professional golfer has to fix his swing: If he’s consistently hitting every shot to the left side of the fairway, for instance, at some point he’ll make adjustments. Maybe he’ll even overcompensate and start hitting everything to the right side instead.
I shared a similar view before the 2020 election. To make this point, Silver presents the following chart.
Going back to 1998, Silver finds that on average, polls are biased towards Democrats by 1.3% in presidential races, 0.9% in governor races, 0.7% in the Senate, and 1.2% in the House. That doesn’t seem too bad! In each of the presidential elections since 2000, you’re dealing with over 100 million votes cast, so to be on average only 1.3% biased towards one party seems quite amazing.
Yet is going back to 1998 really the best way to understand polling error? It was a different country back then. Here’s what the electoral map looked like just two years before in 1996.
Does a country where the Democratic nominee for president can prevail in Arkansas and Louisiana tell us anything useful about American politics in 2020? In 1996, Clinton won West Virginia by almost 15 points. In 2020, Trump beat Biden by 39 in the same state! At some point, you go so far back in the past that what was happening in an earlier election doesn’t provide useful data. Everyone would probably agree that whether a Calvin Coolidge voter in 1924 was willing to talk to pollsters has little to do with Trump’s base in 2020, despite the two presidents belonging to the same party.
Moreover, Gallup shows that between 1996 and 2018, phone response rates dropped from 36% to 6%. This is another reason not to think that the Clinton era has much to tell us about polling today.
Yet if you go too far in the other direction and only look at 2016 and 2020, you probably can’t say anything either, because the sample size is too small.
This becomes a judgment call, and where you place the cutoff matters for how biased the polls look. I made the table below, which shows that when you start the analysis matters a great deal.

If we use a standard measure of statistical significance, taking each polling average for a specific kind of race (president, governor, Senate, House) in each year as a data point, in three different models we find a bias towards the Democrats in House elections. Other kinds of elections usually don’t show any bias, except if we limit our sample to 2014-2020, in which case we find statistically significant tilts towards Democrats in presidential, gubernatorial, Senate, and House elections.
I don’t have a high degree of confidence in these results. Since 2014, there have only been 4 election cycles, including 2 presidential elections. I feel embarrassed to put stars next to those numbers, even if I am technically allowed to. Nonetheless, there is no reason I can see why 1998 as a starting year is obviously superior to 2002, 2012, or 2014. There’s a tradeoff the further you go back, as your sample size grows but you risk introducing noise that makes it more difficult to discern patterns that are based in our politics today.
Focusing only on the last few election cycles, Vox looked at 48 competitive Senate races between 2014 and 2020, and found that the polls underestimated Republicans in 40 of them. Moreover, while Silver argues that there was no substantial bias in Senate polls in 2018, a look at the closest races – the ones we actually care about and where organizations have put the most effort towards getting things right – shows the problem with this view.
In other words, the only reason Silver is able to say that Senate polls weren’t biased in 2018 is because he included a lot of polls of non-competitive races.
Taking the data together, I think there’s a decent amount of evidence for a trend in which the polls started out relatively unbiased, but have been getting more biased towards Democrats over time. It’s not very strong evidence, but the problem with hoping for anything better is that the longer you wait in order to gain more observations, the more the world changes. It therefore wouldn’t be appropriate to say “let’s wait until 2050 so we have a decent sample size,” because by that time the two major parties, and in all likelihood American society itself, will be unrecognizable to us today. This is a problem with political science more generally – findings can be historically contingent and it is always open to interpretation how much they can help in forecasting the future.
The Midwest Plus Pennsylvania Problem
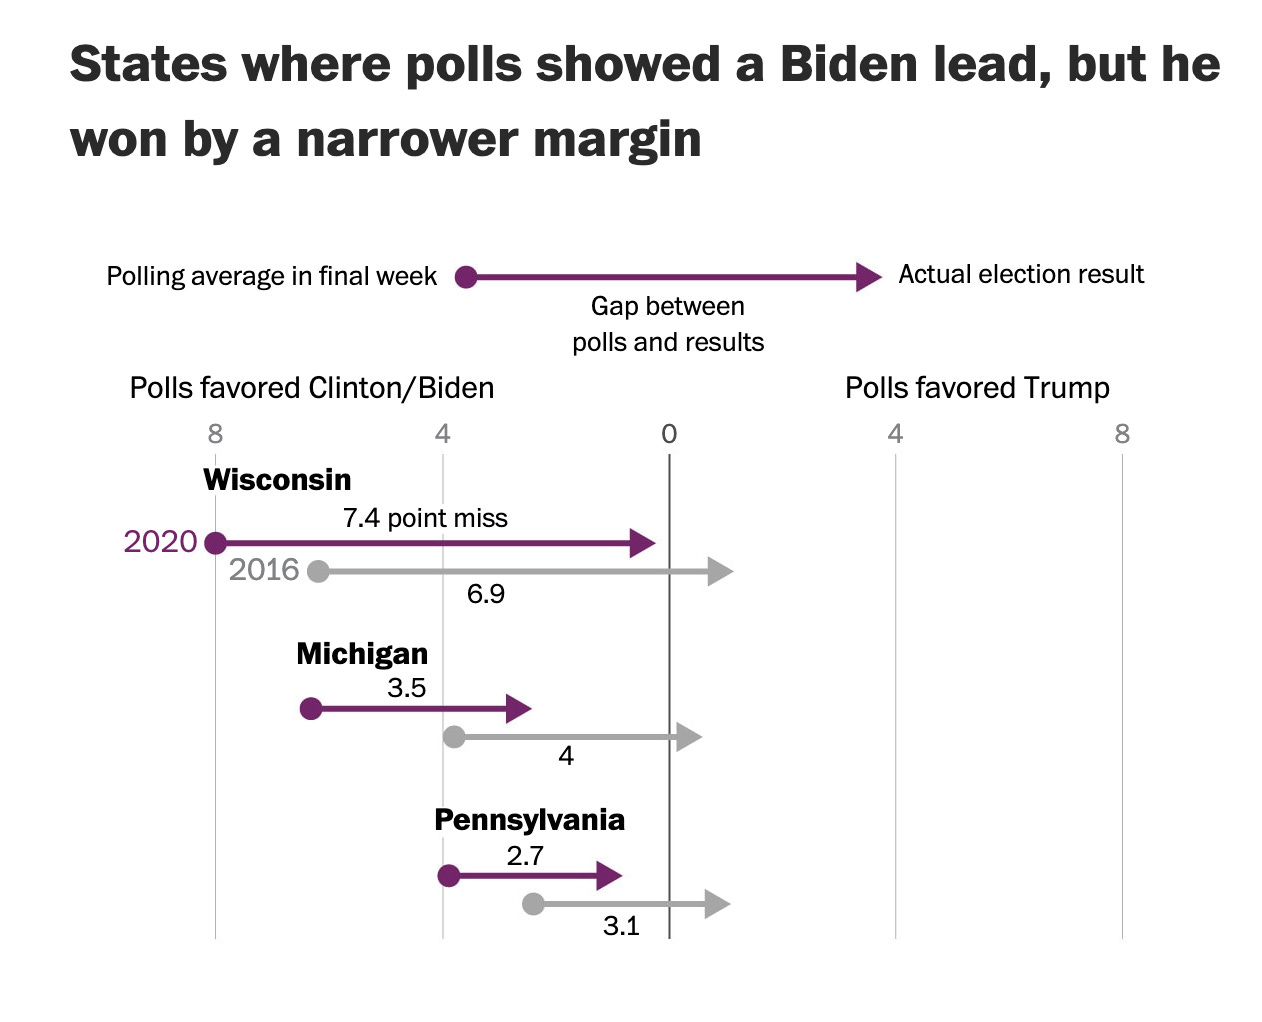
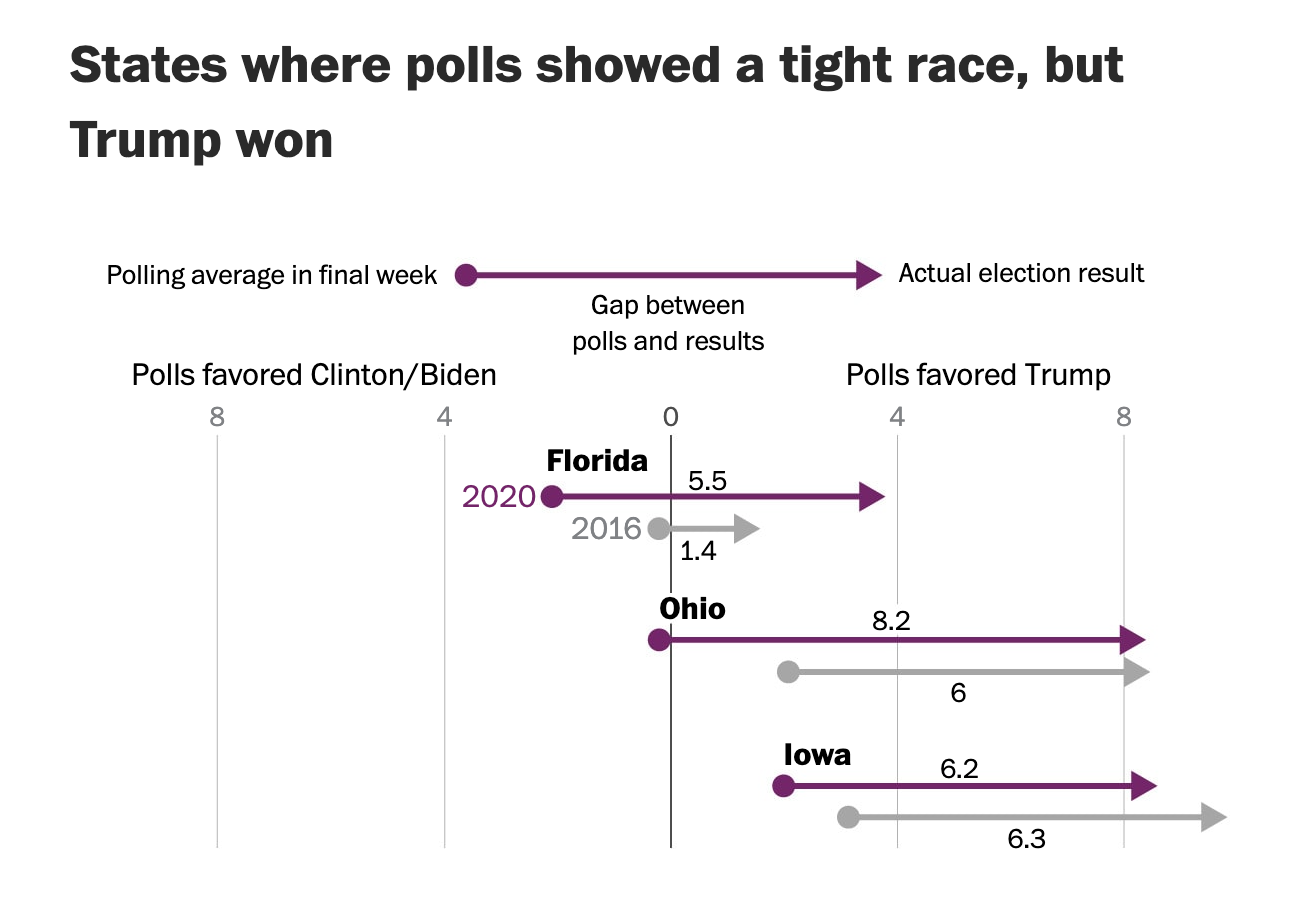
Both times Trump ran, the polling errors looked very similar at the state level.
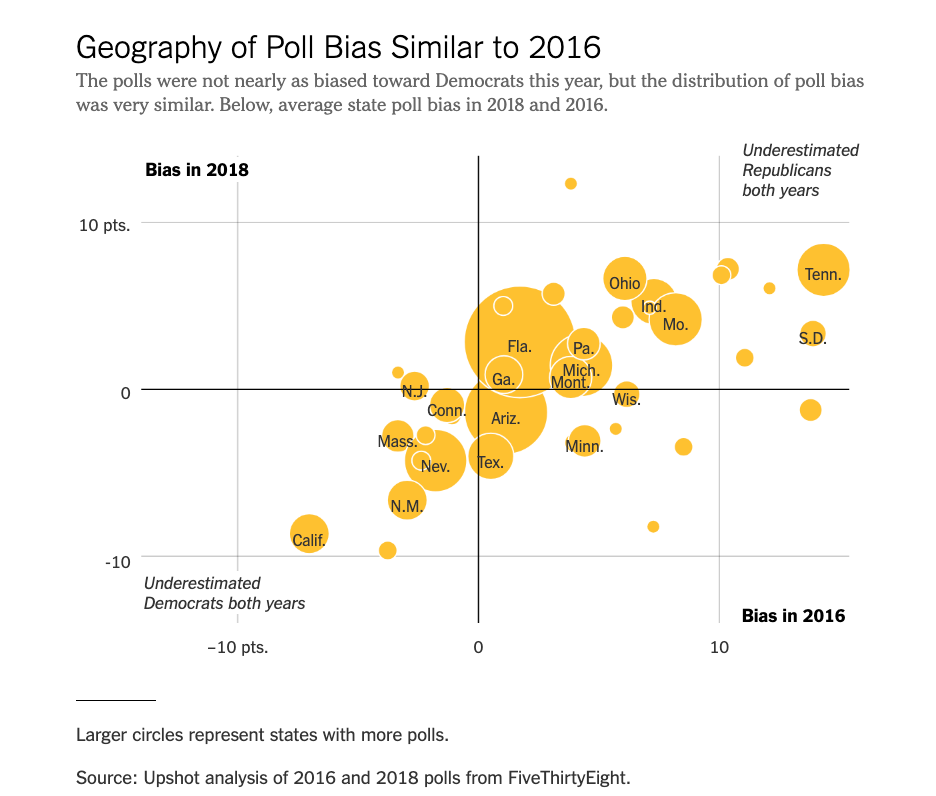
In both 2016 and 2020, there were misses between 2.7 and 8.2 points in Iowa, Michigan, Ohio, Pennsylvania, and Wisconsin. Whatever pollsters did between those two elections, it clearly didn’t work. In fact, we saw the same Midwest plus Pennsylvania bias towards Democrats in 2018 statewide races, although not in Wisconsin.
Once again, as the chart above indicates, this isn’t just an issue with presidential elections. In Indiana in 2018, the last 5 polls recorded by RealClearPolitics had the Democratic candidate winning by 1.3. The Republican won by 5.9. In Missouri, Josh Hawley was only leading by 0.6, but he ended up winning by 6.
Polling Error Based on Unobserved Characteristics
After similar misses in three straight election cycles, it might be reasonable to assume that this time we will if anything see an overcorrection. The problem with this view is that there is no guarantee that there will always be a way to reliably unbias the polls. To understand why, it’s useful to look at how exactly pollsters got 2016 and 2020 wrong.
After Trump was elected, many pollsters looked back and realized that they might have undersampled whites without a college degree, at least in certain states. Presumably, there is an easy fix here, which is just to work harder to reach this group, or weigh the responses one receives from them more heavily next time. The same logic holds if the problem is not enough Hispanics, women, or any other identifiable demographic that is underrepresented.
But what if the problem is that Republican voters are the type of people that don’t talk to pollsters? And the few Republicans that do talk to them are unrepresentative of the party itself? If this were the case, then there would be no clear fix. A recent paper by Vanderbilt University professor Joshua Clinton and two colleagues called “Reluctant Republicans, Eager Democrats? Partisan Nonresponse and the Accuracy of 2020 Presidential Pre-Election Telephone Polls” indicates that this is exactly what is happening.
The authors looked at 12 competitive states in the 2020 election. Telephone surveys as part of the National Exit Poll by Edison Research were conducted between October 19 and November 1, 2020. In some states, those making the phone calls had access to the party registration of the people they were trying to reach, while in others potential respondents were given an imputed partisan lean based on demographic characteristics. Republicans were 3.2 points less likely than Democrats to cooperate with pollsters, and Independents were even more non-responsive.
The bigger problem is that even when you correct for this non-response bias, the polls still don’t become accurate in Arizona, Iowa, Michigan, Minnesota, Pennsylvania, or Wisconsin, although they do in Colorado.
This indicates that something else is going on other than an undersampling of Republicans. This is evidence that the Republicans they are reaching may not be representative of the party. As the authors write,
In the worst case of Wisconsin, likely Republicans according to the voter file were less likely to cooperate with the survey, less likely to self-identify with the Republican Party, and nearly 50 percent reported having voted for Biden. While some of this seems likely to be measurement error in the partisanship measure of the voter file being used, it also raises the possibility that the likely Republicans who cooperated with the poll were much more likely to support Biden than the likely Republicans who did not respond.
Of course, given that Biden only won Wisconsin by 0.6%, there is no way that Trump only won half of Republicans in that state. What this paper is saying is that either the Republicans that the pollsters were reaching were highly unrepresentative, or maybe they weren’t any good at imputing partisanship in the first place.
Either way, it’s not clear what pollsters can do about the problem. One might simply give Republicans a boost based on your best guess of how the sample is biased. But unlike simply undertaking a bit of race or party balancing, at that point you’re just engaging in witchcraft. The entire enterprise of polling depends on people telling you what they think, and there is no way to force them to cooperate if they don’t want to. There’s also no guarantee that, even when accounting for differences based on observable demographic traits, people who respond to pollsters will resemble those that don’t.
The figure below shows how bad callers were at getting people to respond in the National Exit Poll. In Michigan, for example, pollsters got into touch with 7.8% of those they tried to contact. Of that group, only 10% ended up cooperating.
Thus, after trying to contact 159,829 people, you end up with 1,232 responses, or 0.8% of the original population. If you’re the kind of person who pollsters can find and who is willing to talk to them, you are already part of a highly unusual minority. And given the major differences in lifestyle and psychological predispositions between conservatives and liberals, there is no reason to think that they will be equally likely to talk to a pollster.
This is why Nate Silver’s story about the golfer adjusting his swing might not be a good analogy. A golfer is trying to manipulate an inanimate object. The polling problem can be thought of as a putter adjusting his swing while trying to hit a golf ball that is trying to avoid being hit, and that might even have some hostility towards the individual holding the club. While in Silver’s putter analogy only the pollster has agency, in real life normal citizens do too.
Nate Cohn recently argued that the polling warning signs are flashing again. Democrats seem to be doing much better than expected in Pennsylvania and Wisconsin in most of the polls we have seen. And once again, Trafalgar Group is going out on the limb by showing much tighter races. We’ll all find out if history repeats itself on November 8.
The Great Silver-Taleb Debate
If you can’t trust polls to be unbiased, are there better methods you can use to forecast what is going to happen in future elections? In 2020, Nate Silver and Nassim Nicholas Taleb got into a Twitter spat, which is summarized in this article. Without getting too technical, Taleb thinks it’s ridiculous to give too high of a probability either side will win months before an election, given that there is so much uncertainty in the world. Thus, he’d prefer a simple heuristic that says “I dunno, it’s about 50/50” even when polls show one candidate clearly ahead. This would have been a bad approach to take back when we still had presidential landslides, but it would have worked at least as well as the polls in most elections since 2000.
In addition to the 50/50 rule, you might just want to outsource your thinking to the betting markets.
Here’s a graph from a paper comparing average polls from the last week of 16 elections, relative to what was forecasted in a prediction market run out of the University of Iowa.
A possible objection to this is that even polls taken within the last week of a campaign only capture that particular moment, so it would be unfair to compare their outcomes to prediction market snapshots on the eve of an election. Here’s a paper arguing that if you correct for this tendency, polls and betting markets perform about equally well. Since much of this literature has been published, we’ve moved into the Trump era. The 2016 presidential election ended with FiveThirtyEight looking better than prediction markets, but prediction markets doing better than other prognosticators who relied more naively on the polls and did not take into account the possibility of systematic bias. In 2020, betting markets beat both Nate Silver and the polls.
It’s important to note that we haven’t seen anything resembling a fair fight between pollsters and betting markets. That’s because polling operates with the support of major media and other institutions and without any legal restrictions. Meanwhile, betting markets are treated as gambling, and forbidden in all but a few cases. PredictIt, for example, has only been allowed to operate with an $850 per contract limit, and the feds are apparently not going to even let that continue.
If betting markets and polls are about evenly good in theory, we should want betting markets to do the work for us because the costs of running them are low. Meanwhile, pollsters need to keep an army of political scientists employed to figure out how they can correctly gauge public opinion.
Issue Polling is Even Worse
If there are reasons to be skeptical about election polling, then issue polling is probably in even worse shape. Surveys about how people will vote can be checked against reality, and adjusted when they fail. But issue polling doesn’t even have that advantage. While election polling arguably resembles a real science because it has some built-in accountability, issue polling is like academic fields that can move further and further away from reality because there isn’t even the possibility of accountability.
People might want to avoid saying that they want to vote Republican for reasons of social desirability bias. But social desirability bias is even stronger on sensitive issues surrounding race, gender, and sexual orientation. I suspect that issue polling might be particularly unreliable on precisely these topics. Of course, even if you reach a representative sample of people willing to be honest with you, issue polling has the problem that so much depends on how questions are worded and what facts are presented to people. But for our purposes here we can set that problem aside, and see that even carefully conducted polls may not be able to tell us much about public opinion.
A 2013 study showed that support for gay marriage in ballot initiatives was 5-7 points higher in polls than it was on election day. The time period covered in the study was 1998 to 2012, and the problems with polling and reaching the low-trust Republican crowd appear to have gotten much worse since then, as has suppression towards politically incorrect views on LGBT issues. Every so often, the media announces record support for gay marriage. It’s impossible to know how much of this is a legitimate shift in public opinion, and how much is due to the changing demographics of people who take polls. Eric Kaufmann found that the number of young people who identified as LGBT in Canada and the UK was much higher in polls than in census figures that capture a representative sample of the population. All of this indicates that LGBT issues are unusually prone to social desirability bias or the problem of unrepresentative samples. In this area, we probably can’t put much stock in what people say they favor in surveys, or even how they describe themselves.
Similarly, polls tell us that since 2018, a majority of Americans have supported Black Lives Matter. I believe that’s what pollsters find, but I don’t think that reflects public opinion.
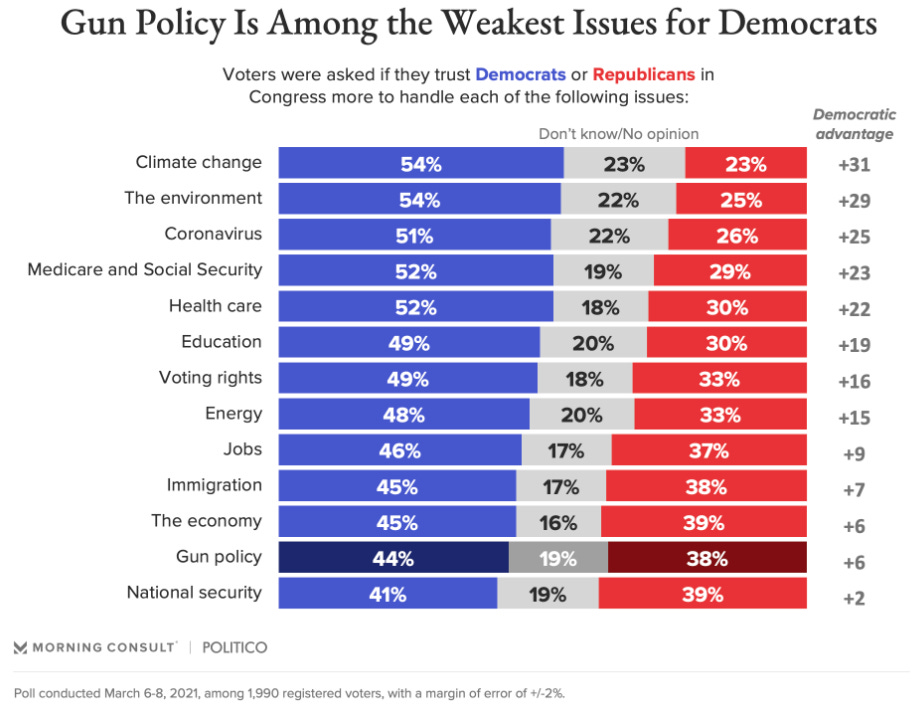
The following 2021 graph from Morning Consult should give you another reason for skepticism. It finds that the public trusts Democrats over Republicans to handle every single issue area.
This is a somewhat extreme example, but it’s pretty normal to find Democrats dominating these kinds of polls. Yet somehow Republicans remain competitive.
The specific issue also matters beyond whether it invokes the subject of identity politics. Polls on coronavirus restrictions seem to be subject to an extreme liberal bias, perhaps one that is worse than what we find on race and LGBT issues. This might be because those who are afraid of covid are more likely to stay home and pick up the phone. At least until pretty late in the pandemic, polls indicated that most Americans wanted masks and other restrictions forever. A few days after a judge threw out the mask requirement on planes, a poll showed 56% of Americans supporting such a mandate and only 24% opposed. That’s pretty hard to reconcile with videos of passengers celebrating the end of the mask mandate, and the fact that almost everyone took theirs off as soon as they could. A survey just this month showed 60% of Americans saying they would wear a mask on a plane, and anyone who has flown recently knows that either people are lying or pollsters aren’t reaching a representative sample of the population. Democratic politicians sure don’t treat permanent covid restrictions as a winning issue, even if polls indicate that they probably should.
On the other hand, when polls show most people supporting the Democratic position on abortion since the Dobbs ruling, we can probably take that seriously. We saw a pro-life initiative go down by a huge margin in Kansas, and Republicans have done worse in elections since the Supreme Court handed down its decision. Assuming politicians know what they’re doing and have a good sense of where the public is, we can also see that Democrats are eager to talk about the issue while Republicans are running from it. Since Dobbs, Democrats have spent one-third of their TV ad money emphasizing their pro-choice position, and in the first few weeks of September, they “aired more than 68,000 ads on TV referencing abortion — more than 15 times as many as their Republican counterparts.” Perhaps people who are pro-life are more likely to talk to pollsters than those who are conservative on other issues, although this is speculation. For their part, Republicans are focusing most heavily on crime.
In sum, polling data is never completely useless, but be ready to discount any results when they contradict other evidence that is out there in the world.
What’s Going to Happen in November?
FiveThirtyEight presents three forecasting models for each race: lite, which is polls only; classic, which takes into account fundraising and the partisan lean of a state or district among other factors; and deluxe, which throws in expert opinions too. The table below shows current forecasts for various races according to the FiveThirtyEight lite model, the deluxe model, PredictIt, and the Salem Center/CSPI forecasting tournament.
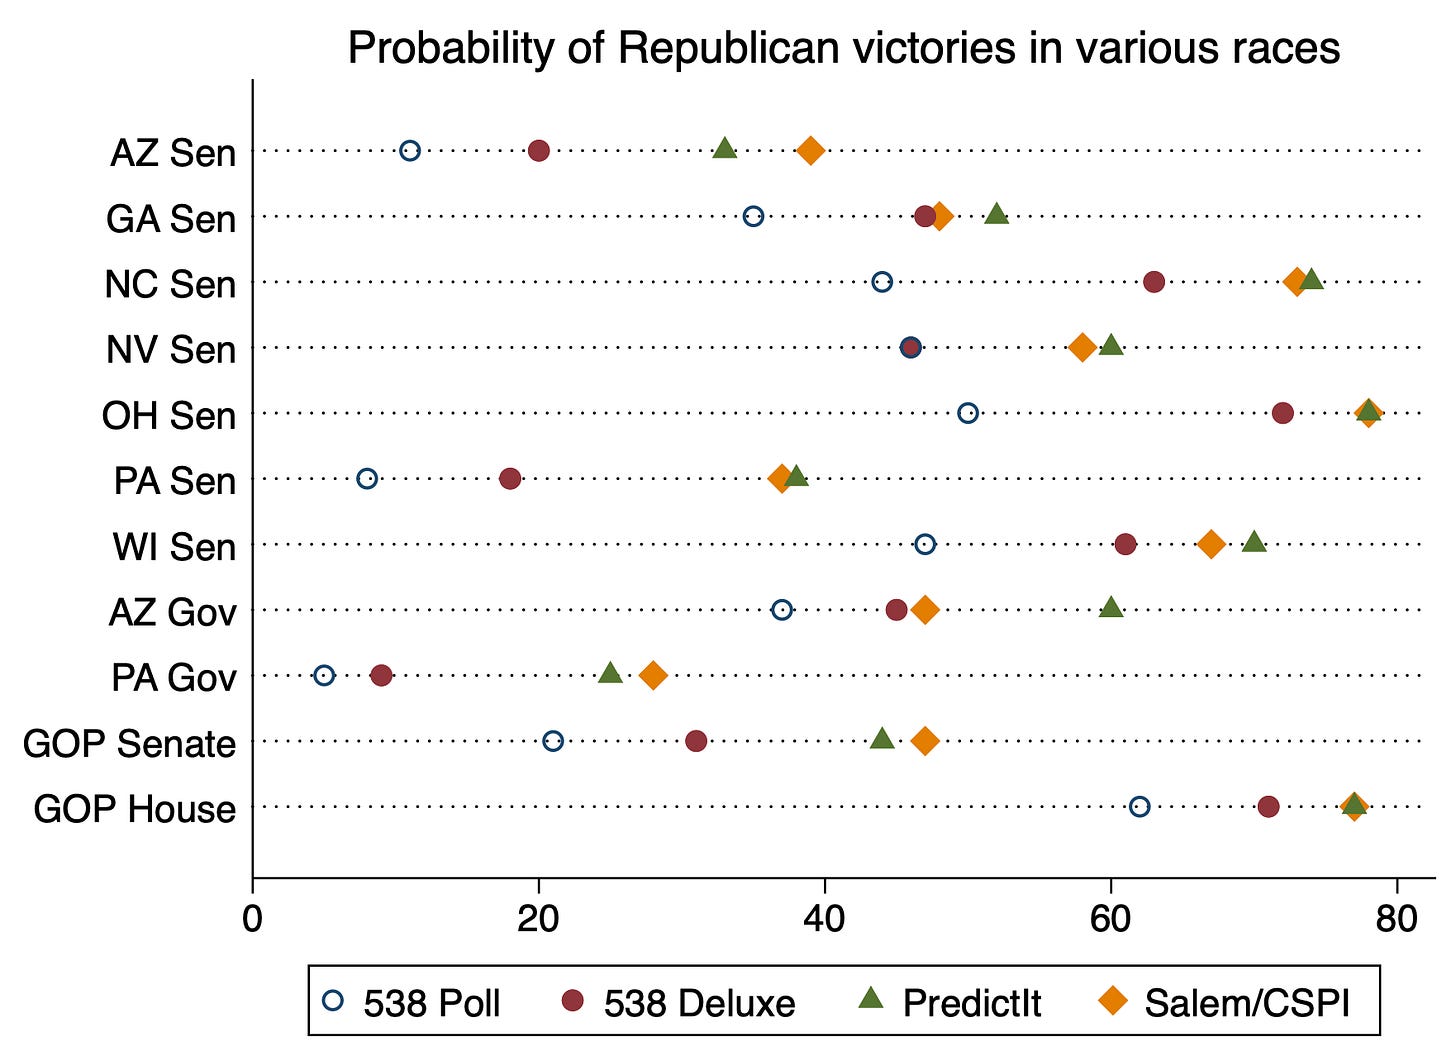
Note that FiveThirtyEight already thinks the polls are biased towards Democrats, with the deluxe version of each race or forecast giving Republicans a better chance than the polls-only model, except in the Nevada Senate race where the two are tied. But PredictIt and the Salem Center/CSPI forecasting tournament think that they haven’t gone far enough in correcting any polling bias. And these are not small disagreements. On average, the FiveThirtyEight deluxe model gives Republicans 10.6 points over the polls-only model. Salem/CSPI and PredictIt are on average a further 11 points ahead of the deluxe model.
The biggest gap is in the Pennsylvania Senate race, where polls predict that Oz only has an 8% chance of winning, and the deluxe model ups him to 18%. But the market seems to be looking at Fetterman and saying that can’t be right, thus putting the Republican in the race at just under 40% at Salem/CSPI and PredictIt. The fact that Salem/CSPI and PredictIt tend to be extremely similar despite them having very different incentive structures implies that they are converging on a true market price in each race or forecast.
A few more markets from the Salem/CSPI forecasting tournament are worthy of note here. We ask whether the FiveThirtyEight deluxe model will favor Republicans to take the Senate on Election Day. As of September 26, the market puts the probability at 22%, significantly less than the 47% chance it gives Republicans of actually taking the Senate.
We also ask whether the FiveThirtyEight popular vote forecasts will have on average at least a three-point bias towards Democrats in the Senate races in Ohio, Pennsylvania, and Wisconsin. As of September 26, that is also at 47%. Note that this market is based on the deluxe model, which as previously mentioned already gives a boost to Republicans. Salem/CSPI participants clearly think there is a good chance of a repeat of 2016, 2018, and 2020.
Recently, there was a hint that Nate Silver himself might be starting to have doubts about his own models. In a podcast released on September 15, he was asked by Galen Druke about his assumption that we have no reason to assume the polls will keep overestimating the prospects of Democrats (about 34 minutes in).
Druke: What would have to happen for you to give up that prior?
Silver: If I were just convinced that the polls were systematically biased and that couldn’t be fixed, then I probably wouldn’t run a polling website anymore.
Druke: Interesting. But what would have to happen in the real world? What would be an indicator to you that there was a systematic bias? How many election cycles would we have to get through?
Silver: At least two more.
Agree or disagree, the man is not afraid to put his name on the line, and this conversation reminded me of why I find Silver such an honest analyst.
By November 8, we’ll know whether he will be sticking around FiveThirtyEight for a while, or perhaps starting the process of finding some other project to devote his considerable talents to.




Two unmentioned possibilities for leftward bias of polls: 1) many are push-polls designed to produce that result and discourage Republican voters; 2) media outlets live in subscription silos and can't afford to offend the people who pay their salaries.
I always lie to the pollsters, so do several other people I know.