Survey Results I: Basic Demographics and Politics
Young, successful, secular, and right-wing

Thanks to everyone who participated in the Richard Hanania Newsletter survey. I received 1,275 responses, for a response rate of about 12%. The latter number is probably an underestimate, because when I post something only about half of the e-mail recipients open it. This implies that my regular readership is close to half of my number of official subscribers, which would mean a true response rate of something close to a quarter of all regular readers.
I previously promised to leave the survey open until August 1, but decided to close up today. This is because responses were petering out, and I had more time to do data analysis today than I will have next week. Leaving the survey open a few more days to get at most 15 or so extra responses might have delayed this post by two weeks, and I decided it wasn’t worth it.
I think I’m going to break things up into three parts:
I. Basic demographics and politics
This post will talk about basic demographic information and the political orientation of my readers.
II. Likes and dislikes (UPDATE: See here)
I will analyze the results regarding what my readers like and dislike, and discuss which things I most disagree with them on.
III. Birth order effects (UPDATE: See here)
Scott Alexander discovered birth order effects among his readers, and I tried to replicate his findings in this survey. That topic deserves its own essay.
In describing the results, I’m going to round all percentages to the nearest whole number, except for numbers under 10%, where I’ll go to the first decimal place. I think that’s the best choice for readability.
Basic Demographics
I knew that my readership would be overwhelmingly male. Razib told me his audience was around 85%. For me it’s 93%, making me even more masculine than him. This means there were 91 women who took the survey.
You guys are gayer than I thought you’d be. Overall, 91% are heterosexual, 3.2% are gay, 3.4% bisexual, and 1% asexual. Less than 1% of respondents said that they were either non-binary (8 individuals) or trans (3 individuals). Among men, 3.4% were gay, and 2.8% were bisexual. But among women, nobody identified as gay, and 11% were bisexual.
You are overwhelmingly white (shame!), at 88%, with 76% indicating white only. The second most popular “race” was Jewish, at 8.3%, making Jews easily the most overrepresented population in my survey results, with about two-thirds of them also choosing white. Someone indicated that they were very annoyed that I included Jews as a separate ethnic group, as apparently this must be some kind of very dangerous knowledge to have.
The lack of representation of East Asians is particularly interesting, given their high socioeconomic status. Only 1.4% checked East Asian alone, about the same number who were white-East Asian hybrids. Other races with non-negligible representation are South Asians (3.7%), Hispanic (3.2%), Middle Eastern (1.8%), and Black (1.4%). Racial differences in political interest is not something we talk much about, but East Asians and Jews seem to be at the opposite ends of the spectrum.
My readers are extremely young. According to this link, using slightly different years than I did, only 22% of Americans are Millennials, while my share is nearly double that, at 43%. Also overrepresented is Generation X, at 25% compared to 20% in the American population. Boomers and older are significantly underrepresented. I don’t know what to make of the Generation Z numbers, they are supposedly 20% of the population, but only 14% of my readers, though I don’t think you can reasonably expect me to have many 1 year old subscribers.

Of course, up to this point, I am assuming all of my readers are Americans, which is not true, with only 74% saying that they come from the United States. That is actually less than I expected for a newsletter focused so much on American politics. The other most common countries are also English-speaking: the UK (5.9%), Canada (4.8%), and Australia (2.9%). After those come Germany (1.7%) and India (1.2%). Every other country is less than 1%. The age distribution of American readers looks almost exactly the same as it does for the entire audience, so it doesn’t matter that I used our generations as a benchmark.
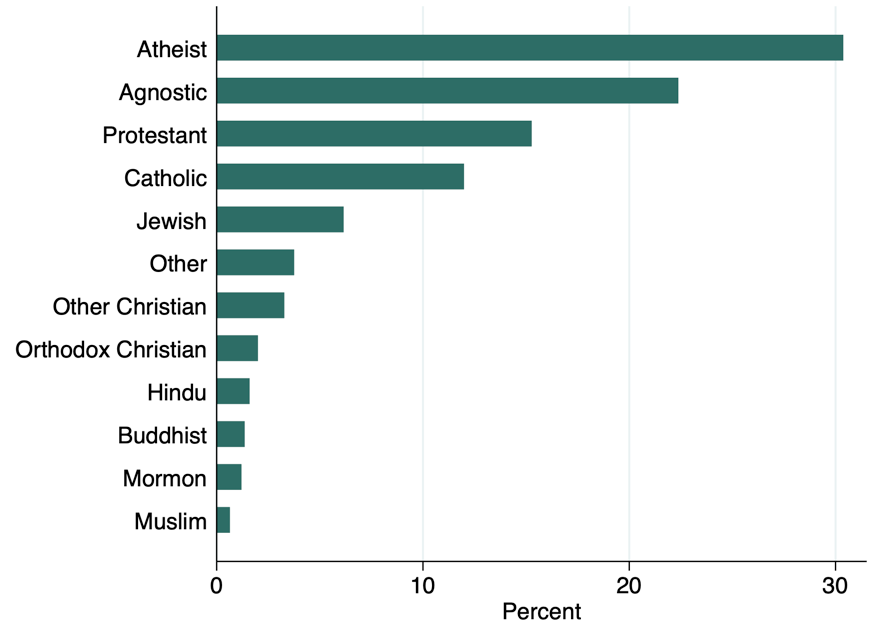
My readers are very secular. Just over half are either Atheist or Agnostic. The third most popular religion is Protestant at 15%, and then Catholic at 12%. Interestingly, I have fewer people describing themselves as religiously Jewish (6.2%) than Jewish in racial terms. And now you see why you need the race question.
You Are the Super Elite
Looking at the education and financial data makes me feel like Trump talking to his supporters.
About 90% have at least a Bachelor’s degree, while 56% have a Master’s or higher. There are also extremely high numbers of PhDs (18%), JDs (10%), and MDs (4.3%).
Two-thirds have an average household income of at least $100K, and over a third over $200K, with the latter number putting someone at about the 90th percentile for all Americans. And this probably underestimates the success, because I asked about income averaged over the last three years, and for many wealthy Americans their earnings fluctuate from year-to-year. So someone who earned $200K this year probably (I think) would be expected to have some kind of regression to the mean.

The fact that you’re an unusually young readership makes this more impressive. If you look at income for everyone who is not Generation Z, meaning 28 or older, 72% make at least $200K.
I asked what industry people worked in. Around 29% work in tech, including 5% who are tech business owners. The second largest industry was academia at 19%.

Politics
You guys identify as economically conservative, socially moderate, and overall conservative.

I always have trouble with the “social issues” question. I tend to be anti-feminist, anti-LGBT tyranny, anti-woke on racial issues, and think parents should have complete control over their children. But I’m also in favor of abortion rights, IVF, and the legalization of drugs. I’m for plastic surgery to make people look more like idealized versions of their own sex, but not the opposite thing. I think I’m a “social conservative” in the American context because feminism and LGBT issues are more salient. But if our politics would be something else, I could see myself identifying as socially liberal. Maybe my readers were similarly confused.
Asking people to identify themselves politically produced some interesting results.
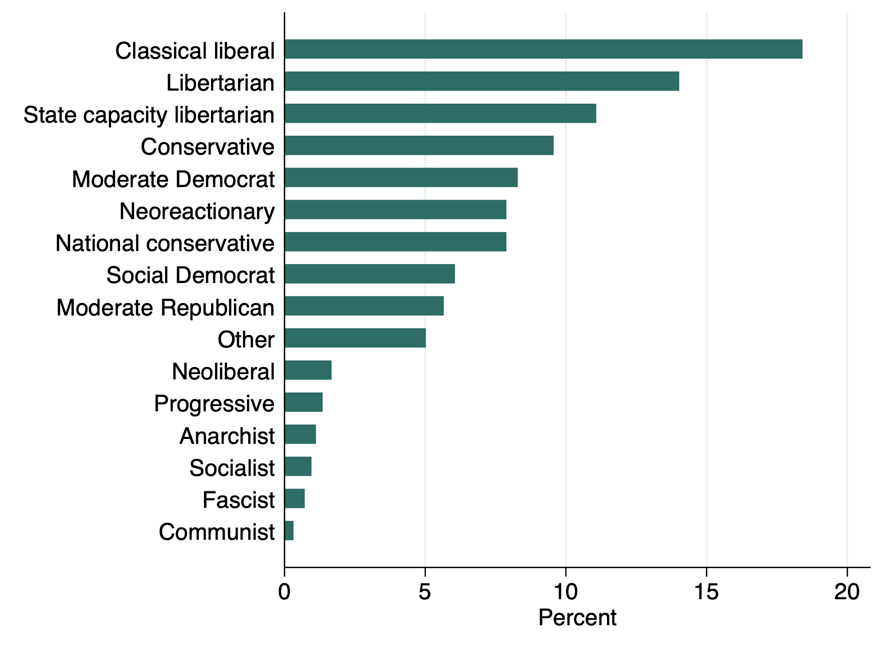
If you count classical liberalism as a libertarian ideology, that means 44% are libertarians of some kind. The fact that 11% of you call yourselves “state capacity libertarians” is pretty amazing given that this ideology was invented by Tyler Cowen in January 2020. If you combine Conservative, National Conservative, and Moderate Republican into one category, it equals 23%. Self-described Neoreactionaries make up 8%, which is obviously higher than in the general population. There are no major sex differences here, as women pick one of the three libertarian options at just a slightly higher rate than men.
I think I might’ve identified as a state capacity libertarian at the start of the pandemic, but I’ve grown increasingly pessimistic about governance to the point that I assume the state will always be stupid and oppressive and making it more competent will only allow it to be better at being stupid and oppressive. Things like civil rights law, the war on drugs, and covid restrictions are more tolerable than they otherwise would be precisely because of slack in enforcement. If you want a country with enough state capacity to actually fight covid, that’s China, and I don’t want that. It’s not just an American failure, as the universality of the extreme overreaction to covid makes me skeptical of state capacity at a more general level. European governments were still doing lockdowns at the end of 2021! If someone has an idea for making government better at cost-benefit analysis, I’d like to hear it, but aiming for competence before you’ve done that strikes me as the wrong path to take.
It’s interesting that “classical liberal” is the most popular option. To be honest, people who describe themselves in this way tend to annoy me. I imagine them as the kind of people who think Critical Race Theory is bad but you shouldn’t ban it, because public schools have a God-given right to use tax dollars to teach your kids to hate themselves without anyone being able to object because otherwise you’d be Orban or something. But I’m probably being unfair, I’m sure many are good people.
The Missing Conservative Readers
If you look at my growth in number of subscribers over time, you can make out three clear inflection points.
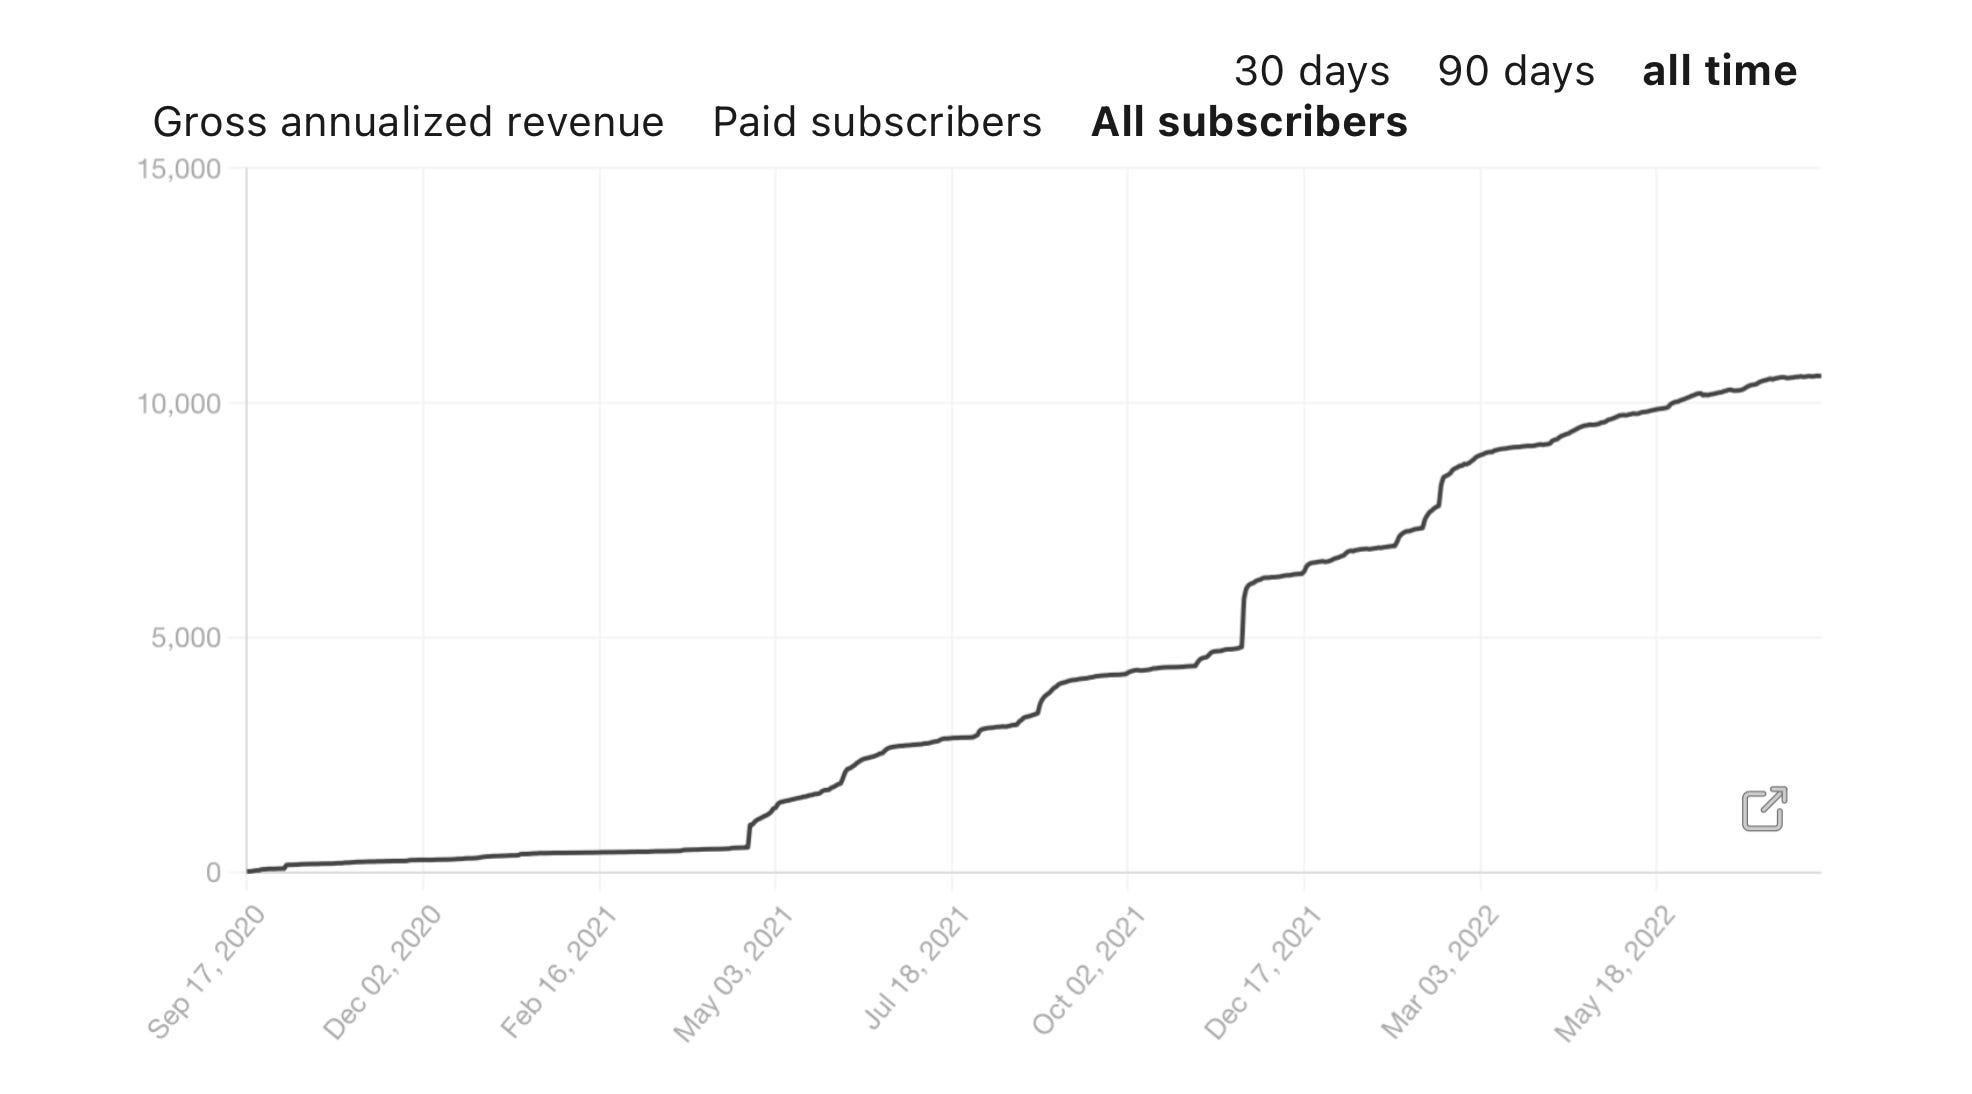
They are,
The publication of “Why Is Everything Liberal?” on April 22, 2001, added 476 subscribers in one day (not including days after).
Praise from Tyler on November 21, 2021, 1,026 in one day.
Praise from Tucker while on his show on February 14, 2022, 438 in one day.
Substack also has this cool feature that allows you to see which websites have directed the most traffic to your newsletter. My top 20 are below.

After “Twitter” and “direct,” third place is Revolver News, which is surprising. Also cracking the top 20 are Bongino Report, PJ Media, and Power Line. I think conservatives really loved reading about women’s tears.
All of this made me expect that many of my readers would have found me through right-wing media. But that isn’t the case, as can be seen below.

Excluding those who don’t remember, the most common sources are Twitter (37%), Tyler Cowen (26%), and Scott Alexander (15%). Yet right-wing media sources are almost completely missing. Just 1.3% said that they found my Substack through Tucker, which is fewer than Bryan Caplan or Razib. Another way to look at this is that Revolver has sent 17 times as much traffic to my Substack as Scott Alexander, but not a single respondent said that they found me from that site.
So where are all the readers from right wing media? There are two possibilities. First, as I once said, liberals read, conservatives watch TV, and fans of Scott Alexander are probably much more likely to stick around here than those of Tucker or Revolver. Second, I think conservatives might just not like filling out surveys as much. One of the commentators to a previous post said he didn’t want to answer personal questions, and I think conservatives are much more likely to have this reaction than rationalists or libertarians. So this would be the 2016 and 2020 elections all over again, where a lot of Trump supporters didn’t want to talk to pollsters. One interesting data point is that when I went to Twitter and asked for someone to give me a ride to the airport recently, the guy who picked me up said he originally saw me on Tucker. Having already noticed the anomaly of the missing conservatives, I asked him if he’d taken the survey, and he said no.
Sex and Reproduction
59% of you are married, and that breaks down to 59% of men and 63% of women. Here’s number of sexual partners.

The median here is 5, which is the same for both sexes. I keep expecting female readers to be different than male readers, but they’re pretty much the same on almost everything. Gay men of course have the most number of sexual partners, with 69% having had at least 10, and 54% having had 20 or more. Here is number of children.

One individual responded that he had at least 10 biological children. Assuming that he has exactly 10, that gives my readers an average of 1.13, with that number being slightly higher at 1.3 if you exclude Gen Z. If you take out both Gen Z and Millennials, so it leaves you only with those at least 43 years old, you get up to 1.75, which would be decent for a European country. That’s lower than I was hoping for, as I would like to see my readers enjoy the joys of parenthood and genetically prosper. Of course, it’s statistically possible that the one guy who reported 10+ actually has hundreds of children and single-handedly brings the average up on his own.
Among those who are at least 43 years old, the most liberal respondents had 1.4 kids each, compared to 2.5 for the most conservative. There’s also a positive relationship between fertility and income. Men who make less than $100K a year have 0.35 children, compared to 1.27 for $100K-$200K, and 1.56 for $200K or more. This is not just a function of age, because when I run a regression predicting fertility based on income and generation, both are statistically significant (p < .001 for both). If you just look at men 43 years old or over, those making less than $100K a year have an average of 1.09 children, compared to 1.98 for those making over $100K a year.

There are major differences by religion. Atheists and Agnostics have an average of 0.86 children, compared to 1.55 for Protestants, 1.46 for Catholics, and 1.6 for Orthodox Christian. I have 15 Mormon readers, and they win with 3.2. Basically, the differences in fertility for my readers look like they do for the general population, with the more conservative and more religious having more kids, but with a stronger connection between income and fertility than we find among the public.
What Surprised Me
I was expecting more conservatives and people coming from right wing media, and fewer libertarians. But I should’ve predicted this based on my previous writings on the differences between conservatives and liberals, in which I pointed out that libertarians are closer to liberals in having more of a literate culture. I expected my readers to match my (non)religious outlook and politics, and they pretty much did by being secular, clearly right-wing on economics, and ambivalent on social issues.
I’m pleased to see that my readership is so young, that hopefully gives them many more years to influence the world. The combination of youth plus income is impressive. You guys have too many degrees, as do I, but it’s ok because you’ve managed to make money and therefore redeemed yourselves. Fertility is about where I expected, though I wish it were higher.
You’re gayer than I expected. I also thought there would be major sex differences, but there really weren’t except for bisexuality.
For reasons noted above, I think that compared to my actual readership, the survey is biased towards having more libertarians and fewer conservatives, which is why we see so few saying that they found this newsletter through Tucker, Revolver, etc. The same reasoning would imply that liberals are also overrepresented as respondents, though only 16% identified as on the left on the five-point scale.
I’m probably going to make the data publicly available later in some form. I may do so by removing the personal stuff about kids, income, etc., and leaving people with basic demographic information and the part where respondents rate everything.
A set of the population in which my recommendation is almost as powerful as Tucker Carlson's! ;)
The survey was also too long. I almost didn’t finish filling it out since with 3 kids and a job I have other things to do. Also it would have been nice if it had been formatted a little better (sections were too long which is annoying on a cell phone).